
Email your feedback and
queries to: propertyqs@
thesundaily.comX
H
AVING
covered both the
sub-sale residential
markets in Sabah and
Sarawak over the last two
weeks, we highlight the outlook in
Selangor via this brief summary by
iProperty Group data services
general manager Premendran
Pathmanathan.
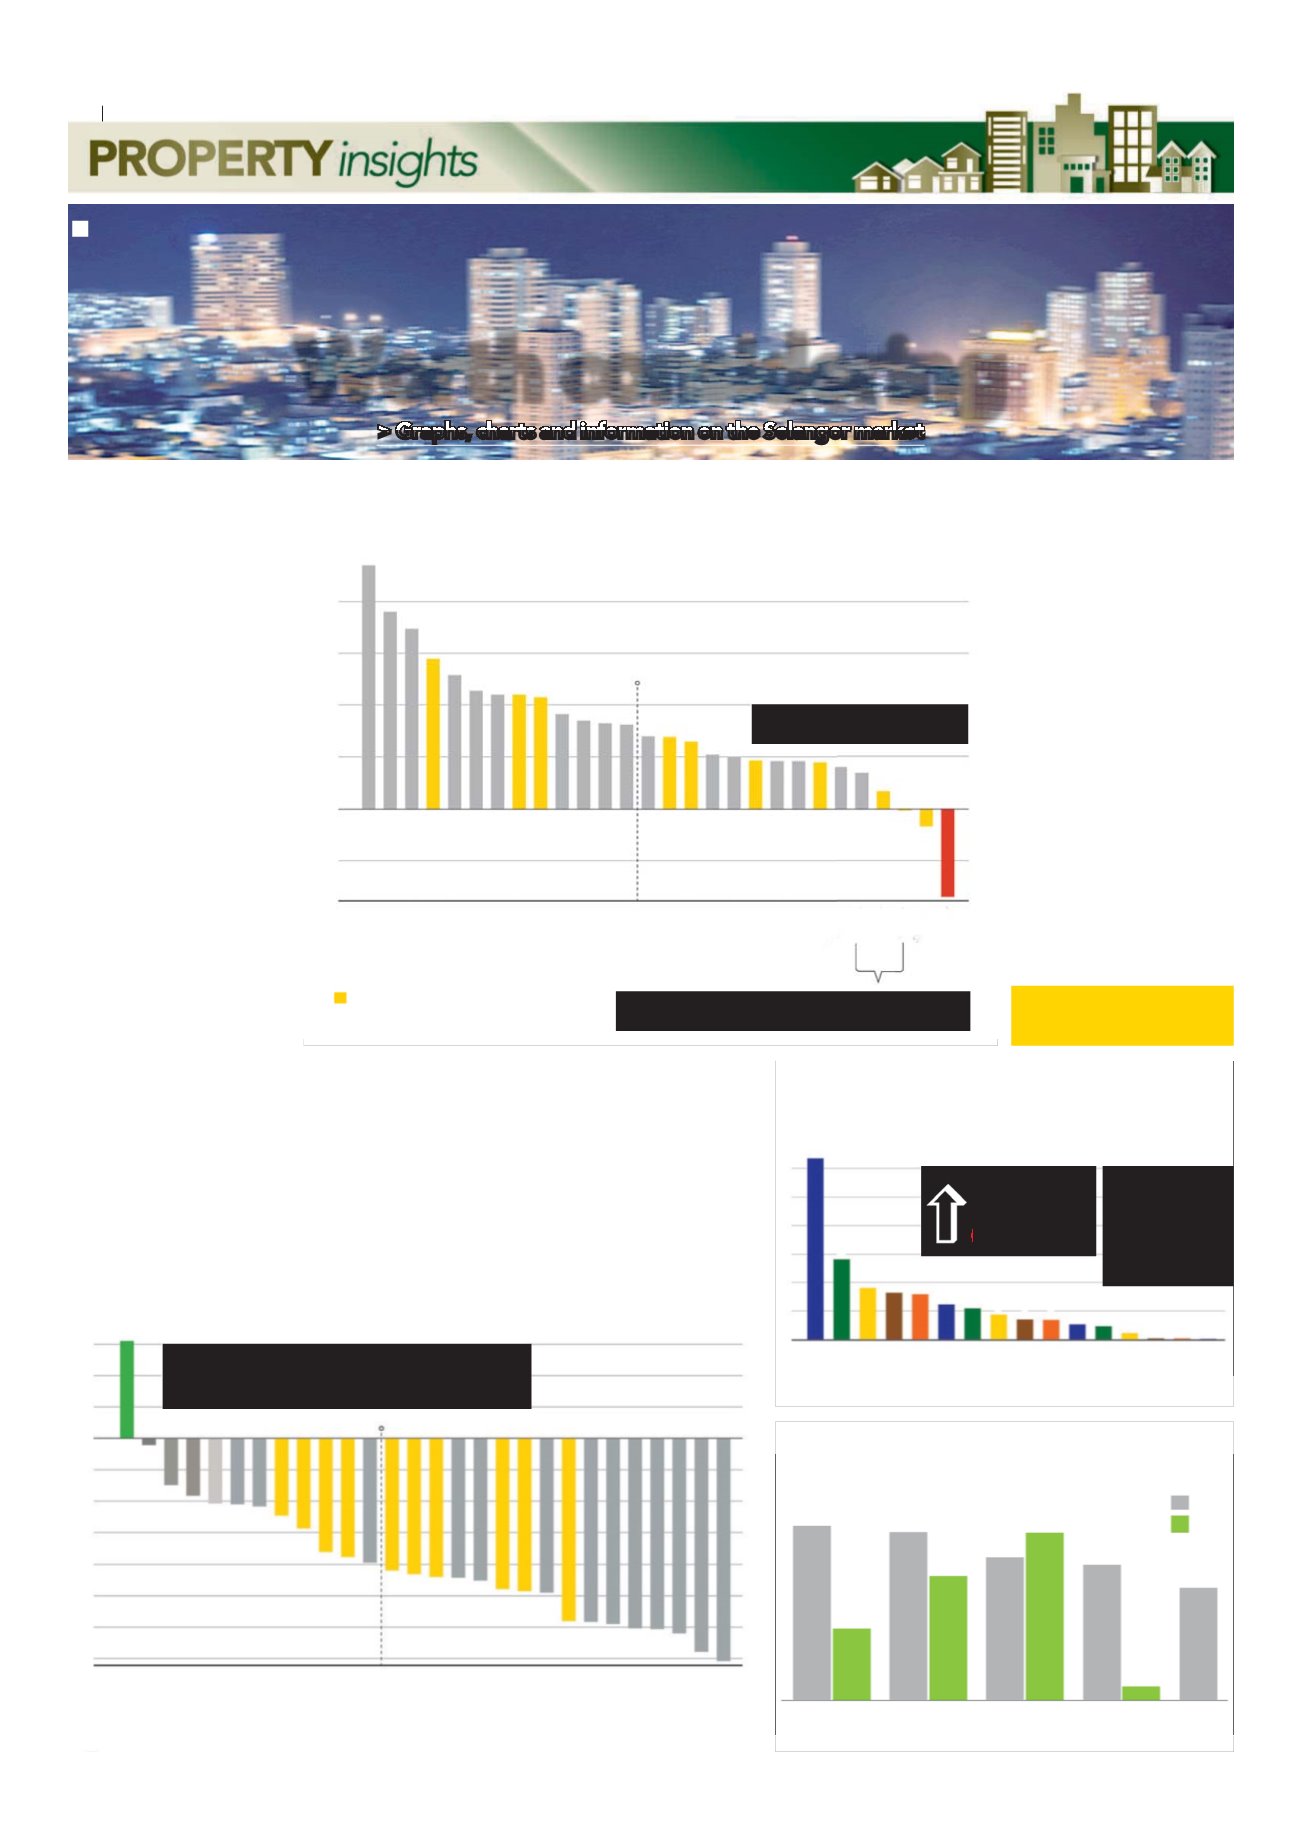
In terms of sales volume,
Selangor emerged the best-
performing state against the
country’s market share (refer C).
Although there was a drop of 17.6%,
looking at year-on-year (Y-O-Y)
figures, Selangor achieved 31.7%
(28,467 transactions) according to
data retrieved betweenNovember
2015 andOctober 2016.
Interestingly, Penang was the
only state which performed better
thanMalaysia’s average (-20.4%),
while Kelantanwas the only state
that recorded a positive trendwhere
its Y-O-Y transactionmovement
increased by 6.7%.
Fromdata shared by iPropertyiq.
com, themost transacted areas in
Selangor were:
1) Klang
2) Shah Alam
3) Puchong
4) Ampang
5) Cheras
6) Kajang
7) Seri Kembangan
8) Petaling Jaya
9) Subang Jaya
10) Kapar
These top 10 areas comprise 50%of
(roughly 14,234) the number of
transactions of sub-sale residential
sales in Selangor (refer B).
Looking at the top transacted
areas, it was noted that transaction
volume fell across all areas except
for Setia Alamwhich rose by 15.4%
in sales, from 596 to 688
transactions. This is said to be
caused by the price factor.
In all, 11 other areas in Selangor
performed better than the state’s
average of -20.4%, with four doing
above average – Subang Jaya,
Cheras, Petaling Jaya and Shah
Alam.
Price wise, capital appreciation
for each state is measured by the
annual change inmedian prices per
sf. Fromdata recorded, all states
flourished except for Sabah.
Selangor fared below average
while Johor led the pack, more than
doubling that of Selangor’s
performance, four times more than
KL’s performance. Johor’s median
price per sf increased to RM266 psf
fromRM221 psf.
In terms of Y-O-Y capital growth
performance in Selangor, Puncak
Alamemerged tops with annual
capital growth reaching 23.4% (refer
A). Performing above average were
Kapar, Seri Kembangan and Klang.
Of the top 10 areas, Subang Jaya and
Petaling Jaya suffered capital
depreciationwith values declining
by 0.14% and 1.7% respectively.
Residential prices in Setia Alam
dropped in value by 8.5%, from
RM397 psf to RM368 psf.
While terrace homes measuring
1,500sf to 2,000sf made the cut as the
most popular product type aspiring
home buyers searched for, themost
popular products that were actually
sold turned out to be flatsmeasuring
500sf to 700sf, costing below
RM100,000 (refer D). Information
garnered fromdata revealed that
that there is a huge difference
betweenwhat home buyers are
interested in andwhat they are
purchasing. Affordability could be
themain reason.
In all, there are plusses and
minusses, whether buying newor
sub-sale. Weigh the pros and cons
and do your research beforemaking
a decision. While newproperties
may cost more (depending on the
size, location, etc.), sub-sale
residentials can come with a can of
worms or bring you years of happy
and comfortable living.
Followour column next week on
interior decor, followed by
residential sub-salemarket reports
on Johor and Penang.
>Graphs, charts and information on the Selangor market
Worth considering
SELANGORCAPITAL GROWTH YEAR-ON-YEARCHANGE (%)
+23%(RM257psf)
Capital Growth YoY Change (%)
20
15
10
5
0
-5
OverallSelangorY-O-Ychange (+7.4%)
-8.5%
(RM368psf)
PUNCAKALAM
SUNWAY
BANDARKINRARA
KAPAR
ULUKELANG
TANJONGDUABELAS
SUNGAIBULOH
SERIKEMBANGAN
KLANG
KOTADAMANSARA
SEPANG
SELAYANG
RAWANG
SEMENYIH
AMPANG
KAJANG
BATUCAVES
SERENDAH
PUCHONG
DAMANSARAPERDANA
BANGI
SHAHALAM
KEPONG
DAMASARADAMAI
CHERAS
PETALINGJAYA
SUBANGJAYA
SETIAALAM
Top10 transactedareas inSelangor
PUNCAKALAM
SUNWAY
BANDARKINRARA
KAPAR
ULUKELANG
TANJONGDUABELAS
SUNGAIBULOH
SERIKEMBANGAN
KLANG
KOTADAMANSARA
SEPANG
SELAYANG
RAWANG
SEMENYIH
AMPANG
KAJANG
BATUCAVES
SERENDAH
PUCHONG
DAMANSARAPERDANA
BANGI
SHAHALAM
KEPONG
DAMASARADAMAI
CHERAS
PETALINGJAYA
SUBANGJAYA
SETIAALAM
YoY Transaction Change (%)
15
10
5
0
-5
-10
-15
-20
-25
-30
-35
15.4%
OverallSelangorY-O-Ychange(-20.4%)
35.4%
SELANGOR TRANSACTIONS Y-O-Y CHANGE (%)
TRANSACTION VOLUME BY STATE (%)
Selangor
Johor
KualaLumpur
Penang
Perak
Kedah
N.Sembilan
Sarawak
Pahang
Malacca
Terengganu
Sabah
Kelantan
Perlis
Labuan
Putrajaya
TransactionsMarketShare (%)
30
25
20
15
10
5
0
31.7
14
9
8.2
7.9
6.1
5.4
4.3
3.5
3.4
2.6
2.3
1.1
0.2
0.2
0.1
SOLD – MOST POPULAR PRODUCTS SOLD
COMPARED TO LEADS RECEIVED
Sold
Leads
Terrace
500-750sf
RM192k
Terrace
750-1,000sf
RM278k
Terrace
1,500-2,000sf
RM625k
Apartment
750-1,000sf
RM255k
Flat
500-700sf
RM100k
Setia Alam, which recorded 688 sales compared to 596
previously, is the only area in Selangor which did not experience
a drop in transactions. Is price the factor?
Setia Alam experienced the biggest
drop in value in Selangor.
PJ (0.1%) and Subang Jaya (2%) is the only other two areas in
Selangor that have experienced a value drop as well.
28,467
sold
(-20.4%y-o-y)
Malaysia
Transaction
Volume
RM89.8k
(-17.6%y-o-y)
Residential sub-sale market report
A
B
C
D
20
theSun ON FRIDAY
|
MARCH11,2016
22
theSun ON FRIDAY
|
JULY28,2017


